January 8, 2021
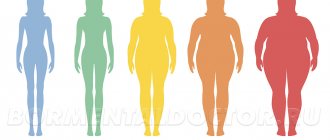
- How to understand if you are overweight: calculate your body mass index
- Eat a balanced diet
- Stay hydrated
- Play sports
- Get enough sleep and smile
The goal determines the result. Do you want to lose weight? Then you should know how to correctly calculate excess weight and what figure to strive for.
In such a responsible matter, you should not look up to friends, fashion bloggers, or rely only on personal feelings. How to find out how much excess weight you have? Calculate BMI - body mass index (BMI, Body Mass Index) by calculating weight by height online.
Determining your body mass index will help you understand whether your current weight is normal, underweight or overweight. This is a springboard from which everyone who cares about their health and figure should start. BMI is often used to calculate drug doses and determine the risk of developing diseases associated with obesity or wasting.
How to understand if you are overweight: calculate your body mass index
Body mass index is calculated using the formula: BMI = weight in kg / (height in m)2
For automatic calculation, use our body mass index calculator for women and men: just enter your height and weight into the excess weight calculator to calculate your body mass index for free.
Body Mass Index (BMI) Calculator
Compare the resulting number with the body mass index values in the table:
| Body mass index | Correspondence between a person's mass and his height |
| less than 16 | Severe underweight |
| 16–18,5 | Underweight |
| 18,5–25 | Norm |
| 25–30 | Excess body weight (pre-obesity) |
| 30–35 | Obesity of the first degree |
| 35–40 | Obesity of the second degree |
| 40 or more | Obesity of the third degree |
Notes: 1. You will receive an average value: ideally, you need to calculate weight for weight loss taking into account your body type, age and height. 2. Professional athletes with well-developed muscles will have a higher BMI, because muscle is heavier than fat. 3. You should not calculate BMI during pregnancy. 4. This BMI calculation is not suitable for children under 19 years of age: according to WHO, BMI for this age group is calculated differently [].
If you are obese or underweight, it is important to seek advice from a qualified specialist: any deviations from the norm can cause diseases and disruptions in the body.
To achieve and maintain a healthy weight, you need to work on:
- food;
- water balance;
- lifestyle;
- mood.
This is exactly what Amway's comprehensive Body Detox program teaches.
Let's talk about the physical development of the child. The main indicators for its assessment are weight, height and their ratio - body mass index (BMI). BMI is not determined until the age of two. Therefore, from birth to two years, centile tables are used, in which all parameters are divided into 7 corridors.
How to use centile tables. The article presents three versions of tables separately for boys and girls: height, weight and weight-to-height ratios. So in the “Age” column, find the child’s age (in the tables the value is in months of life) and in the corresponding line look for which “Zone” (Corridor) the value of your child’s height or weight falls into. In total, the table is divided into 7 “Zones” (Corridors).
| Zone (Corridor) | 1 | 2 | 3 | 4 | 5 | 6 | 7 |
| Meaning | short stature or malnutrition | low but acceptable height or weight parameters | value below average | average height and weight in the population | above average value | high height or weight | extremely tall or overweight |
The assessment of physical development begins with the child’s growth. Afterwards the child’s weight is determined.
- The height and weight of the child, located in the green zone, corresponds to the norm.
- Height and weight that fall into the yellow zone correspond to borderline values. Additional monitoring of the child is required.
- If your height and weight fall into the red zone, you need to consult your pediatrician to identify various abnormalities that lead to impaired physical development.
To assess the degree of obesity or underweight, weight-to-height tables are used.
- Values falling into zone 1 are regarded as malnutrition.
- Values falling into the 2nd zone are regarded as low weight.
- Zones 3-5 are the norm.
- 6th zone excess weight.
- 7th zone obesity.
Boys
Height
Boys 0 months - 2 years.
| Age | Centiles | |||||||||||
| 3 | 10 | 25 | 75 | 90 | 97 | |||||||
| Zones | ||||||||||||
| 1 | 2 | 3 | 4 | 5 | 6 | 7 | ||||||
| 0 months | 48,0 | 48,9 | 50,0 | 53,2 | 54,3 | 55,1 | ||||||
| 1 | 50,5 | 51,5 | 52,8 | 56,3 | 57,5 | 58,7 | ||||||
| 2 | 53,4 | 54,3 | 55,8 | 59,5 | 61,0 | 62,1 | ||||||
| 3 | 56,1 | 57,0 | 58,6 | 62,4 | 64,0 | 65,5 | ||||||
| 4 | 58,6 | 59,5 | 61,3 | 65,6 | 67,0 | 68,7 | ||||||
| 5 | 61,0 | 61,9 | 63,4 | 67,9 | 69,6 | 70,9 | ||||||
| 6 | 63,0 | 64,0 | 65,6 | 69,9 | 71,3 | 72,5 | ||||||
| 7 | 65,0 | 65,9 | 67,5 | 71,4 | 73,0 | 74,1 | ||||||
| 8 | 66,5 | 67,6 | 68,9 | 73,0 | 74,5 | 75,7 | ||||||
| 9 | 67,8 | 68,8 | 70,1 | 74,5 | 75,9 | 77,1 | ||||||
| 10 | 68,8 | 69,9 | 71,3 | 76,1 | 77,4 | 78,2 | ||||||
| 11 | 69,9 | 71,0 | 72,6 | 77,3 | 78,9 | 80,4 | ||||||
| 12 | 71,0 | 72,0 | 73,8 | 78,5 | 80,3 | 81,7 | ||||||
| 15 | 72,9 | 74,3 | 76,0 | 81,2 | 83,4 | 84,9 | ||||||
| 18 | 75,0 | 76,5 | 78,4 | 84,4 | 86,5 | 88,2 | ||||||
| 21 | 77,2 | 78,6 | 80,8 | 86,8 | 88,2 | 91,0 | ||||||
| 24 | 79,4 | 81,0 | 83,0 | 88,4 | 92,0 | 93,8 | ||||||
Weight
Boys 0 months - 2 years.
| Age | Centiles | |||||||||||
| 3 | 10 | 25 | 75 | 90 | 97 | |||||||
| Zones | ||||||||||||
| 1 | 2 | 3 | 4 | 5 | 6 | 7 | ||||||
| 0 months | 2,4 | 2,7 | 3,0 | 3,7 | 4,0 | 4,4 | ||||||
| 1 | 3,1 | 3,5 | 3,8 | 4,5 | 5,2 | 5,6 | ||||||
| 2 | 3,9 | 4,3 | 4,6 | 5,5 | 6,2 | 6,6 | ||||||
| 3 | 4,5 | 4,9 | 5,4 | 6,4 | 7,0 | 7,5 | ||||||
| 4 | 5,2 | 5,6 | 6,2 | 7,2 | 7,9 | 8,4 | ||||||
| 5 | 5,8 | 6,2 | 6,8 | 7,9 | 8,6 | 9,1 | ||||||
| 6 | 6,4 | 6,8 | 7,4 | 8,6 | 9,2 | 9,7 | ||||||
| 7 | 6,9 | 7,4 | 7,9 | 9,1 | 9,8 | 10,3 | ||||||
| 8 | 7,4 | 7,8 | 8,4 | 9,6 | 10,3 | 10,8 | ||||||
| 9 | 7,8 | 8,3 | 8,9 | 10,1 | 10,9 | 11,3 | ||||||
| 10 | 8,0 | 8,6 | 9,2 | 10,6 | 11,3 | 11,8 | ||||||
| 11 | 8,3 | 8,9 | 9,5 | 11,0 | 11,8 | 12,3 | ||||||
| 12 | 8,6 | 9,1 | 9,8 | 11,5 | 12,2 | 12,7 | ||||||
| 15 | 9,2 | 9,6 | 10,5 | 12,2 | 12,9 | 13,5 | ||||||
| 18 | 9,6 | 10,2 | 11,0 | 12,8 | 13,8 | 14,2 | ||||||
| 21 | 10,1 | 10,6 | 11,5 | 13,5 | 14,3 | 14,9 | ||||||
| 24 | 10,6 | 11,1 | 12,0 | 14,1 | 14,9 | 15,4 | ||||||
Weight to height ratio
Boys 0 months - 4 years. (50-115 cm.)
| Body length | Centiles | |||||||||||
| 3 | 10 | 25 | 75 | 90 | 97 | |||||||
| Zones | ||||||||||||
| 1 | 2 | 3 | 4 | 5 | 6 | 7 | ||||||
| 50 | 2,8 | 2,9 | 3,1 | 3,5 | 3,7 | 3,9 | ||||||
| 51 | 2,9 | 3,1 | 3,3 | 3,7 | 3,9 | 4,1 | ||||||
| 52 | 3,1 | 3,2 | 3,4 | 3,8 | 4,0 | 4,3 | ||||||
| 53 | 3,3 | 3,4 | 3,6 | 4,1 | 4,3 | 4,6 | ||||||
| 54 | 3,4 | 3,6 | 3,8 | 4,3 | 4,6 | 4,8 | ||||||
| 55 | 3,6 | 3,8 | 4,0 | 4,6 | 4,9 | 5,3 | ||||||
| 56 | 3,9 | 4,1 | 4,3 | 4,9 | 5,3 | 5,7 | ||||||
| 57 | 4,1 | 4,3 | 4,6 | 5,2 | 5,7 | 6,1 | ||||||
| 58 | 4,3 | 4,6 | 4,6 | 5,5 | 6,1 | 6,5 | ||||||
| 59 | 4,6 | 4,8 | 5,1 | 5,8 | 6,4 | 6,9 | ||||||
| 60 | 4,8 | 5,1 | 5,4 | 6,1 | 6,8 | 7,3 | ||||||
| 61 | 5,0 | 5,4 | 5,7 | 6,5 | 7,2 | 7,7 | ||||||
| 62 | 5,3 | 5,6 | 6,0 | 6,8 | 7,5 | 8,0 | ||||||
| 63 | 5,6 | 5,9 | 6,3 | 7,2 | 7,8 | 8,4 | ||||||
| 64 | 5,8 | 6,2 | 6,6 | 7,5 | 8,2 | 8,8 | ||||||
| 65 | 6,1 | 6,5 | 6,9 | 7,9 | 8,5 | 9,1 | ||||||
| 66 | 6,4 | 6,8 | 7,2 | 8,2 | 8,8 | 9,4 | ||||||
| 67 | 6,6 | 7,0 | 7,4 | 8,5 | 9,1 | 9,7 | ||||||
| 68 | 6,9 | 7,3 | 7,7 | 8,8 | 9,4 | 10,0 | ||||||
| 69 | 7,1 | 7,6 | 8,0 | 9,1 | 9,7 | 10,2 | ||||||
| 70 | 7,4 | 7,8 | 8,2 | 9,4 | 10,0 | 10,5 | ||||||
| 71 | 7,7 | 8,1 | 8,5 | 9,7 | 10,2 | 10,8 | ||||||
| 72 | 7,9 | 8,4 | 8,8 | 10,0 | 10,5 | 11,1 | ||||||
| 73 | 8,2 | 8,4 | 9,1 | 10,3 | 10,7 | 11,3 | ||||||
| 74 | 8,4 | 8,9 | 9,4 | 10,6 | 11,0 | 11,6 | ||||||
| 75 | 8,7 | 9,2 | 9,7 | 10,9 | 11,5 | 11,9 | ||||||
| 76 | 8,9 | 9,3 | 9,8 | 11,1 | 11,6 | 12,2 | ||||||
| 77 | 9,0 | 9,4 | 9,9 | 11,2 | 11,8 | 12,3 | ||||||
| 78 | 9,2 | 9,6 | 10,1 | 11,4 | 11,9 | 12,5 | ||||||
| 79 | 9,3 | 9,7 | 10,1 | 11,5 | 12,1 | 12,7 | ||||||
| 80 | 9,5 | 9,9 | 10,4 | 11,6 | 12,2 | 12,8 | ||||||
| 81 | 9,8 | 10,1 | 10,5 | 11,8 | 12,4 | 13,0 | ||||||
| 82 | 9,9 | 10,3 | 10,7 | 12,0 | 12,6 | 13,2 | ||||||
| 83 | 10,1 | 10,5 | 10,9 | 12,2 | 12,8 | 13,4 | ||||||
| 84 | 10,3 | 10,7 | 11,0 | 12,3 | 13,1 | 13,7 | ||||||
| 85 | 10,5 | 10,9 | 11,3 | 12,6 | 13,3 | 13,9 | ||||||
| 86 | 10,6 | 11,0 | 11,5 | 12,8 | 13,5 | 14,3 | ||||||
| 87 | 10,7 | 11,2 | 11,7 | 13,0 | 13,8 | 14,5 | ||||||
| 88 | 10,9 | 11,4 | 11,8 | 13,3 | 14,0 | 14,7 | ||||||
| 89 | 11,2 | 11,6 | 12,0 | 13,5 | 14,2 | 14,9 | ||||||
| 90 | 11,3 | 11,8 | 12,2 | 13,8 | 14,5 | 15,2 | ||||||
| 91 | 11,4 | 11,9 | 12,5 | 14,0 | 14,7 | 15,4 | ||||||
| 92 | 11,6 | 12,1 | 12,6 | 14,2 | 15,0 | 15,6 | ||||||
| 93 | 11,9 | 12,4 | 12,9 | 14,5 | 15,2 | 15,8 | ||||||
| 94 | 12,1 | 12,6 | 13,1 | 14,7 | 15,5 | 16,1 | ||||||
| 95 | 12,4 | 12,8 | 13,4 | 15,0 | 15,6 | 16,3 | ||||||
| 96 | 12,6 | 13,0 | 13,7 | 15,3 | 15,9 | 16,6 | ||||||
| 97 | 12,8 | 13,3 | 13,9 | 15,5 | 16,2 | 16,8 | ||||||
| 98 | 13,0 | 13,5 | 14,2 | 15,8 | 16,5 | 17,1 | ||||||
| 99 | 13,2 | 14,5 | 15,1 | 16,1 | 16,8 | 17,4 | ||||||
| 100 | 13,5 | 14,0 | 14,8 | 16,3 | 17,1 | 17,6 | ||||||
| 101 | 13,7 | 14,2 | 15,1 | 16,6 | 17,4 | 18,0 | ||||||
| 102 | 14,0 | 14,5 | 15,3 | 17,0 | 17,7 | 18,3 | ||||||
| 103 | 14,2 | 14,7 | 15,5 | 17,2 | 18,0 | 18,6 | ||||||
| 104 | 14,4 | 15,0 | 15,8 | 17,5 | 18,3 | 19,0 | ||||||
| 105 | 14,6 | 15,2 | 16,1 | 17,7 | 18,4 | 19,2 | ||||||
| 106 | 14,9 | 15,5 | 16,4 | 18,1 | 18,8 | 19,6 | ||||||
| 107 | 15,2 | 15,8 | 16,7 | 18,5 | 19,2 | 20,0 | ||||||
| 108 | 15,5 | 16,2 | 17,0 | 18,8 | 19,6 | 20,5 | ||||||
| 109 | 15,7 | 16,4 | 17,3 | 19,2 | 20,0 | 21,0 | ||||||
| 110 | 16,0 | 16,7 | 17,5 | 19,6 | 20,6 | 21,5 | ||||||
| 111 | 16,2 | 17,0 | 17,8 | 20,0 | 21,0 | 22,0 | ||||||
| 112 | 16,4 | 17,2 | 18,1 | 20,5 | 21,5 | 22,5 | ||||||
| 113 | 16,6 | 17,4 | 18,4 | 20,8 | 21,9 | 23,0 | ||||||
| 114 | 16,9 | 17,6 | 18,7 | 21,2 | 22,4 | 23,5 | ||||||
| 115 | 17,0 | 17,9 | 19,0 | 21,6 | 22,7 | 24,0 | ||||||
Girls
Height
Girls 0 months - 2 years.
| Age | Centiles | |||||||||||
| 3 | 10 | 25 | 75 | 90 | 97 | |||||||
| Zones | ||||||||||||
| 1 | 2 | 3 | 4 | 5 | 6 | 7 | ||||||
| 0 months | 47,0 | 48,0 | 49,2 | 52,1 | 53,3 | 54,5 | ||||||
| 1 | 49,7 | 50,7 | 52,4 | 55,3 | 56,9 | 57,7 | ||||||
| 2 | 52,2 | 53,3 | 55,0 | 58,6 | 59,9 | 60,8 | ||||||
| 3 | 55,1 | 56,1 | 57,9 | 61,5 | 63,0 | 63,9 | ||||||
| 4 | 57,4 | 58,6 | 60,5 | 64,1 | 65,6 | 66,4 | ||||||
| 5 | 59,9 | 61,0 | 62,8 | 66,4 | 67,8 | 68,8 | ||||||
| 6 | 62,1 | 63,0 | 64,3 | 68,2 | 69,9 | 70,8 | ||||||
| 7 | 63,7 | 64,2 | 66,4 | 70,0 | 71,6 | 72,7 | ||||||
| 8 | 65,2 | 66,1 | 67,7 | 71,6 | 73,1 | 75,2 | ||||||
| 9 | 66,5 | 67,5 | 69,3 | 72,8 | 74,5 | 75,8 | ||||||
| 10 | 67,7 | 68,8 | 70,5 | 74,2 | 75,9 | 77,1 | ||||||
| 11 | 69,1 | 70,3 | 71,7 | 75,7 | 77,1 | 78,3 | ||||||
| 12 | 70,3 | 71,4 | 72,8 | 76,3 | 78,3 | 79,3 | ||||||
| 15 | 72,2 | 73,6 | 75,2 | 78,8 | 81,2 | 82,4 | ||||||
| 18 | 74,0 | 74,8 | 77,5 | 82,1 | 84,4 | 86,0 | ||||||
| 21 | 76,0 | 78,2 | 80,2 | 84,6 | 87,4 | 88,8 | ||||||
| 24 | 78,4 | 80,4 | 82,6 | 87,5 | 90,2 | 92,2 | ||||||
Weight
Girls 0 months - 2 years.
| Age | Centiles | |||||||||||
| 3 | 10 | 25 | 75 | 90 | 97 | |||||||
| Zones | ||||||||||||
| 1 | 2 | 3 | 4 | 5 | 6 | 7 | ||||||
| 0 months | 2,3 | 2,6 | 3,0 | 3,5 | 3,8 | 4,0 | ||||||
| 1 | 3,0 | 3,3 | 3,7 | 4,3 | 4,6 | 4,9 | ||||||
| 2 | 3,7 | 4,0 | 4,4 | 5,0 | 5,3 | 5,6 | ||||||
| 3 | 4,4 | 4,6 | 5,0 | 5,7 | 6,1 | 6,5 | ||||||
| 4 | 5,0 | 5,3 | 5,6 | 6,5 | 6,9 | 7,4 | ||||||
| 5 | 5,5 | 5,8 | 6,2 | 7,2 | 7,7 | 8,2 | ||||||
| 6 | 6,1 | 6,3 | 6,8 | 7,9 | 8,5 | 9,0 | ||||||
| 7 | 6,5 | 6,8 | 7,3 | 8,5 | 9,1 | 9,7 | ||||||
| 8 | 7,0 | 7,3 | 7,7 | 9,1 | 9,7 | 10,5 | ||||||
| 9 | 7,4 | 7,7 | 8,2 | 9,6 | 10,4 | 11,2 | ||||||
| 10 | 7,7 | 8,1 | 8,7 | 10,1 | 11,0 | 11,3 | ||||||
| 11 | 8,1 | 8,5 | 9,1 | 10,6 | 11,5 | 12,2 | ||||||
| 12 | 8,3 | 8,8 | 9,4 | 11,0 | 11,9 | 12,6 | ||||||
| 15 | 8,9 | 9,4 | 10,0 | 11,7 | 12,7 | 13,3 | ||||||
| 18 | 9,4 | 9,9 | 10,6 | 12,5 | 13,4 | 13,9 | ||||||
| 21 | 9,8 | 10,4 | 11,1 | 13,1 | 13,9 | 14,6 | ||||||
| 24 | 10,3 | 10,9 | 11,6 | 13,5 | 14,5 | 15,2 | ||||||
Weight to height ratio
Girls 0 months - 4 years. (50-115 cm.)
| Body length | Centiles | |||||||||||
| 3 | 10 | 25 | 75 | 90 | 97 | |||||||
| Zones | ||||||||||||
| 1 | 2 | 3 | 4 | 5 | 6 | 7 | ||||||
| 50 | 2,6 | 2,8 | 3,0 | 3,4 | 3,6 | 3,8 | ||||||
| 51 | 2,8 | 3,0 | 3,2 | 3,6 | 3,8 | 4,0 | ||||||
| 52 | 3,0 | 3,2 | 3,3 | 3,8 | 4,1 | 4,3 | ||||||
| 53 | 3,1 | 3,4 | 3,5 | 4,1 | 4,3 | 4,5 | ||||||
| 54 | 3,3 | 3,5 | 3,7 | 4,3 | 4,5 | 4,8 | ||||||
| 55 | 3,4 | 3,6 | 3,9 | 4,5 | 4,9 | 5,1 | ||||||
| 56 | 3,6 | 3,9 | 4,1 | 4,9 | 5,2 | 5,5 | ||||||
| 57 | 3,8 | 4,2 | 4,4 | 5,2 | 5,6 | 6,0 | ||||||
| 58 | 4,0 | 4,4 | 4,7 | 5,5 | 5,9 | 6,4 | ||||||
| 59 | 4,3 | 4,7 | 4,9 | 5,8 | 6,3 | 6,8 | ||||||
| 60 | 4,5 | 4,9 | 5,3 | 6,1 | 6,6 | 7,2 | ||||||
| 61 | 4,8 | 5,2 | 5,5 | 6,5 | 7,0 | 7,6 | ||||||
| 62 | 5,1 | 5,5 | 5,8 | 6,8 | 7,4 | 7,9 | ||||||
| 63 | 5,4 | 5,8 | 6,2 | 7,2 | 7,7 | 8,3 | ||||||
| 64 | 5,7 | 6,1 | 6,5 | 7,5 | 8,1 | 8,7 | ||||||
| 65 | 6,0 | 6,4 | 6,8 | 7,8 | 8,4 | 9,0 | ||||||
| 66 | 6,3 | 6,6 | 7,1 | 8,1 | 8,7 | 9,3 | ||||||
| 67 | 6,6 | 6,9 | 7,4 | 8,4 | 9,0 | 9,6 | ||||||
| 68 | 6,8 | 7,2 | 7,6 | 8,7 | 9,3 | 9,9 | ||||||
| 69 | 7,1 | 7,4 | 7,9 | 9,0 | 9,6 | 10,2 | ||||||
| 70 | 7,4 | 7,7 | 8,2 | 9,2 | 9,9 | 10,5 | ||||||
| 71 | 7,5 | 7,9 | 8,4 | 9,5 | 10,2 | 10,8 | ||||||
| 72 | 7,8 | 8,2 | 8,7 | 9,7 | 10,4 | 11,0 | ||||||
| 73 | 8,0 | 8,4 | 8,9 | 10,0 | 10,7 | 11,2 | ||||||
| 74 | 8,3 | 8,7 | 9,2 | 10,2 | 10,9 | 11,4 | ||||||
| 75 | 8,5 | 8,9 | 9,4 | 10,5 | 11,2 | 11,6 | ||||||
| 76 | 8,8 | 9,1 | 9,6 | 10,7 | 11,3 | 11,7 | ||||||
| 77 | 8,9 | 9,2 | 9,7 | 10,9 | 11,5 | 11,8 | ||||||
| 78 | 9,0 | 9,3 | 9,9 | 11,1 | 11,6 | 11,9 | ||||||
| 79 | 9,1 | 9,5 | 10,0 | 11,2 | 11,7 | 12,0 | ||||||
| 80 | 9,3 | 9,7 | 10,2 | 11,3 | 11,8 | 12,2 | ||||||
| 81 | 9,4 | 9,9 | 10,3 | 11,5 | 12,0 | 12,4 | ||||||
| 82 | 9,5 | 10,0 | 10,5 | 11,6 | 12,2 | 12,6 | ||||||
| 83 | 9,7 | 10,2 | 10,6 | 11,8 | 12,4 | 12,8 | ||||||
| 84 | 9,8 | 10,3 | 10,8 | 12,0 | 12,6 | 12,9 | ||||||
| 85 | 10,0 | 10,4 | 10,9 | 12,1 | 12,8 | 13,2 | ||||||
| 86 | 10,2 | 10,5 | 11,1 | 12,3 | 12,9 | 13,4 | ||||||
| 87 | 10,4 | 10,7 | 11,3 | 12,6 | 13,2 | 13,6 | ||||||
| 88 | 10,6 | 10,9 | 11,5 | 12,8 | 13,4 | 13,8 | ||||||
| 89 | 10,7 | 11,2 | 11,7 | 13,0 | 13,6 | 14,0 | ||||||
| 90 | 11,0 | 11,3 | 11,9 | 13,3 | 13,9 | 14,4 | ||||||
| 91 | 11,2 | 11,5 | 12,1 | 13,5 | 14,1 | 14,6 | ||||||
| 92 | 11,4 | 11,8 | 12,4 | 13,7 | 14,3 | 14,8 | ||||||
| 93 | 11,6 | 12,0 | 12,6 | 13,9 | 14,5 | 15,1 | ||||||
| 94 | 11,8 | 12,3 | 12,8 | 14,1 | 14,8 | 15,3 | ||||||
| 95 | 12,2 | 12,5 | 13,1 | 14,4 | 15,1 | 15,6 | ||||||
| 96 | 12,3 | 12,8 | 13,3 | 14,7 | 15,3 | 15,8 | ||||||
| 97 | 12,6 | 13,0 | 13,6 | 15,0 | 15,6 | 16,1 | ||||||
| 98 | 12,9 | 13,3 | 13,8 | 15,3 | 15,9 | 16,5 | ||||||
| 99 | 13,1 | 13,5 | 14,1 | 15,5 | 16,3 | 16,9 | ||||||
| 100 | 13,4 | 13,8 | 14,4 | 15,8 | 16,5 | 17,2 | ||||||
| 101 | 13,6 | 14,0 | 14,6 | 16,2 | 17,0 | 17,6 | ||||||
| 102 | 13,8 | 14,3 | 14,9 | 16,5 | 17,4 | 18,1 | ||||||
| 103 | 14,0 | 14,5 | 15,2 | 16,9 | 17,8 | 18,5 | ||||||
| 104 | 14,3 | 14,7 | 15,4 | 17,3 | 18,2 | 19,0 | ||||||
| 105 | 14,5 | 14,9 | 15,7 | 17,7 | 18,6 | 19,4 | ||||||
| 106 | 14,7 | 15,2 | 16,0 | 18,0 | 19,0 | 19,9 | ||||||
| 107 | 14,9 | 15,5 | 16,3 | 18,4 | 19,4 | 20,3 | ||||||
| 108 | 15,1 | 15,7 | 16,7 | 18,8 | 19,8 | 20,7 | ||||||
| 109 | 15,3 | 16,0 | 16,9 | 19,2 | 20,2 | 21,1 | ||||||
| 110 | 15,6 | 16,3 | 17,2 | 19,5 | 20,6 | 21,6 | ||||||
| 111 | 15,8 | 16,6 | 17,5 | 19,8 | 21,0 | 22,0 | ||||||
| 112 | 16,2 | 16,8 | 17,8 | 20,3 | 21,5 | 22,4 | ||||||
| 113 | 16,4 | 17,2 | 18,2 | 20,6 | 21,9 | 22,8 | ||||||
| 114 | 16,7 | 17,3 | 18,4 | 21,1 | 22,3 | 23,3 | ||||||
| 115 | 17,1 | 17,7 | 18,7 | 21,4 | 22,7 | 23,7 | ||||||
BMI in children over 2 years of age
To assess the ratio of weight to height in children over 2 years of age, Body Mass Index (BMI) charts are used, separately for boys and girls.
Distribution of BMI in boys 2-20 years old
Distribution of BMI in girls 2-20 years old
Body mass index (BMI) can be calculated using the formula:
BMI = body weight (kg) / (height in m)².
Then use the chart to find which zone your child’s BMI falls into. The blue color indicates the state of malnutrition (extremely low weight relative to height), and the red color indicates the obesity zone. Yellow color indicates pre-obesity (high weight). The green zone contains normal age-specific BMI values.
You can read what risks are associated with high or low BMI values in the article “Body Mass Index in Adults”. But remember that the Bioimpedance Analysis (BIA) method or bioimpedance analysis most accurately displays the amount of adipose tissue when it is in excess.
Eat a balanced diet
The body must receive the required amount of proteins, fats and complex carbohydrates (BCC). Eat fish and seafood, meat, eggs and dairy products, nuts, cereals and legumes, vegetable oils, green vegetables.
But the body needs proteins, fats and carbohydrates in different quantities. In addition, proteins are divided into complete and incomplete, fats into saturated and unsaturated. Their proportions in the daily diet also differ...
It's easy to get confused about this, especially if you're not very knowledgeable about healthy eating. What foods to choose, how to correctly calculate the calorie content of dishes, what to cook so as not to sit on one salad all day? There are really a lot of questions.
To answer them, Amway specialists have developed a comprehensive Body Detox program. In just 3 weeks you can easily change your eating habits and learn to eat tasty and balanced. Breakfast, lunch, dinner and two healthy snacks: just select several dishes from the Body Detox menu and create your daily diet. There is no need to invent new combinations or constantly eat the same thing, there is no need to manually count calories. All recipes are described step by step, for each dish its calorie content and BJU are indicated.
NUTRILITE™ Appetite control with glucomannan helps to cope with the constant feeling of hunger and the desire to eat more than necessary. There is no need to test your willpower: just mix one portion of the dietary supplement with water or juice and drink shortly before meals. When in contact with water, glucomannan increases from 50 to 200 times, it envelops the stomach, partially fills it and creates a feeling of fullness.
You can even treat yourself to something sweet! But it’s better - in the first half of the day and not too often. Buns and chocolate bars should be replaced with fruits, nuts or a delicious smoothie with a mixture of dietary fiber with NUTRILITE™ inulin.
How much should a person weigh between 2 and 20 years old?
There is no clear answer to the question of the “correct” weight and height of a person. There are quite a lot of objective reasons for this that do not depend on the will of a person, because... nature itself makes adjustments to these indicators, influencing climate, ecology, and genetic factors.
Some of the various recommendations for assessing optimal weight and adjusting it frankly smack of either quackery or dystrophic fashion trends.
Therefore, in this article we focus on health and provide statistical data on the average weight and height of completely healthy children, adolescents and young adults aged 2 to 20 years . Please note that a person's weight is largely determined by their height. So, average weight is the norm only for people of average height. For those whose height differs from the average norm, weights are selected and assessed individually using a BMI calculator.
You can find out the recommended weight for children from birth to 3 years of age in the article “How much should an infant weigh?”
When assessing and adjusting weight, remember that only a person himself can decide for himself how much he needs to weigh, based on personal experience, motivation and opinions imposed from outside.
From our point of view, the main indicator of normal weight is personal comfort, good health and maximum life expectancy in a healthy state. Average weight of healthy people from 2 to 20 years old
| Age (years) | Boy, Youth | Girl, Girl | ||
| Weight, kg) | Height (cm) | Weight, kg) | Height (cm) | |
| 2 | 12,7 | 86,5 | 12,1 | 85,1 |
| 2,5 | 13,6 | 91,1 | 12,9 | 90,0 |
| 3 | 14,4 | 95,0 | 14,0 | 94,0 |
| 3,5 | 15,2 | 98,8 | 14,8 | 97,4 |
| 4 | 16,3 | 102,4 | 15,9 | 100,7 |
| 4,5 | 17,3 | 105,7 | 16,9 | 104,3 |
| 5 | 18,6 | 109,0 | 17,9 | 107,6 |
| 5,5 | 19,6 | 112,2 | 19,2 | 111,1 |
| 6 | 20,9 | 115,5 | 20,2 | 114,7 |
| 6,5 | 21,9 | 118,6 | 21,5 | 118,2 |
| 7 | 23,0 | 121,7 | 22,7 | 121,6 |
| 7,5 | 24,4 | 124,9 | 24,2 | 124,7 |
| 8 | 25,7 | 128,0 | 25,7 | 127,6 |
| 8,5 | 27,1 | 130,7 | 27,3 | 130,3 |
| 9 | 28,5 | 133,4 | 29,0 | 133,0 |
| 9,5 | 30,2 | 136,2 | 30,9 | 135,5 |
| 10 | 31,9 | 138,7 | 32,9 | 138,0 |
| age | weight | height | weight | height |
| 10,5 | 34,0 | 141,2 | 35,0 | 140,9 |
| 11 | 35,9 | 143,5 | 37,0 | 143,8 |
| 11,5 | 38,2 | 146,2 | 39,4 | 147,6 |
| 12 | 40,6 | 149,1 | 41,7 | 151,2 |
| 12,5 | 43,0 | 152,4 | 43,7 | 154,5 |
| 13 | 45,8 | 156,2 | 45,7 | 157,1 |
| 13,5 | 48,4 | 160,2 | 47,7 | 159,1 |
| 14 | 51,1 | 163,9 | 49,4 | 160,4 |
| 14,5 | 53,8 | 167,4 | 50,9 | 161,2 |
| 15 | 56,3 | 170,0 | 52,1 | 161,8 |
| 15,5 | 58,8 | 172,0 | 53,2 | 162,2 |
| 16 | 60,9 | 173,5 | 53,8 | 162,7 |
| 16,5 | 62,9 | 174,6 | 54,6 | 162,8 |
| 17 | 64,7 | 175,3 | 55,1 | 162,9 |
| 17,5 | 66,1 | 175,8 | 55,7 | 163,1 |
| 18 | 67,4 | 176,2 | 56,3 | 163,2 |
| 18,5 | 68,2 | 176,4 | 56,7 | 163,3 |
| 19 | 69,2 | 176,6 | 57,4 | 163,3 |
| 19,5 | 70,1 | 176,8 | 57,8 | 163,4 |
| 20 | 70,7 | 176,9 | 58,2 | 163,4 |
| age | weight | height | weight | height |
| Weight and height of children under 3 years old | ||||
| Child weight and height calculator | ||||
| Adult Weight Calculator | ||||
| Share VKontakteFacebookOdnoklassniki My World | ||||
How to normalize your body mass index
Specific steps:
- You need to make sure that this is really necessary. In pursuit of an ideal figure, many girls act to the detriment of their health, seeing non-existent problems in the mirror.
- If there are still grounds for this, you need to decide on the method of measuring the index. As can be seen from the examples, there is no single approach to determining the ideal weight. Each method is based on certain indicators. And the final result is different.
- If your BMI is noticeably outside the normal range, you need to realize that this is a serious problem. Obesity or underweight are signs of an unhealthy lifestyle that will lead to a decrease in quality of life in the future. Or - this is a signal about existing problems within the body, which can become chronic. The psychological nature of the current state is also possible. In any case, you need to consult a doctor.
- The best option is to have several consultations with nutritionists. Or with licensed fitness instructors. Based on the results of the discussion, choose an acceptable method that takes into account all physiological and age-related characteristics.
- The next step is to analyze your lifestyle and the available options for adjusting it. We must understand that today’s situation is a consequence of yesterday’s actions. Bad habits, lack of activity, or health problems may be to blame. If the first two factors are eliminated by the woman independently, then the last one is eliminated together with the attending physician.
A separate factor is heredity. It should not become a reason for refusing to keep yourself normal. But it is also necessary to take it into account - if no methods bring noticeable results, then you need to learn to accept yourself as you are.
What is BMI and why know it?
The World Health Organization has developed a methodology that determines whether a person’s weight meets accepted standards. Its main indicator is BMI (BMI) – a person’s body mass index, calculated depending on gender and age.
Further in the article, full information about him will be disclosed using the example of women whose height ranges from 150 to 180 cm.